[Infographic] Q2 2026 Irish Commercial Building Market Snapshot
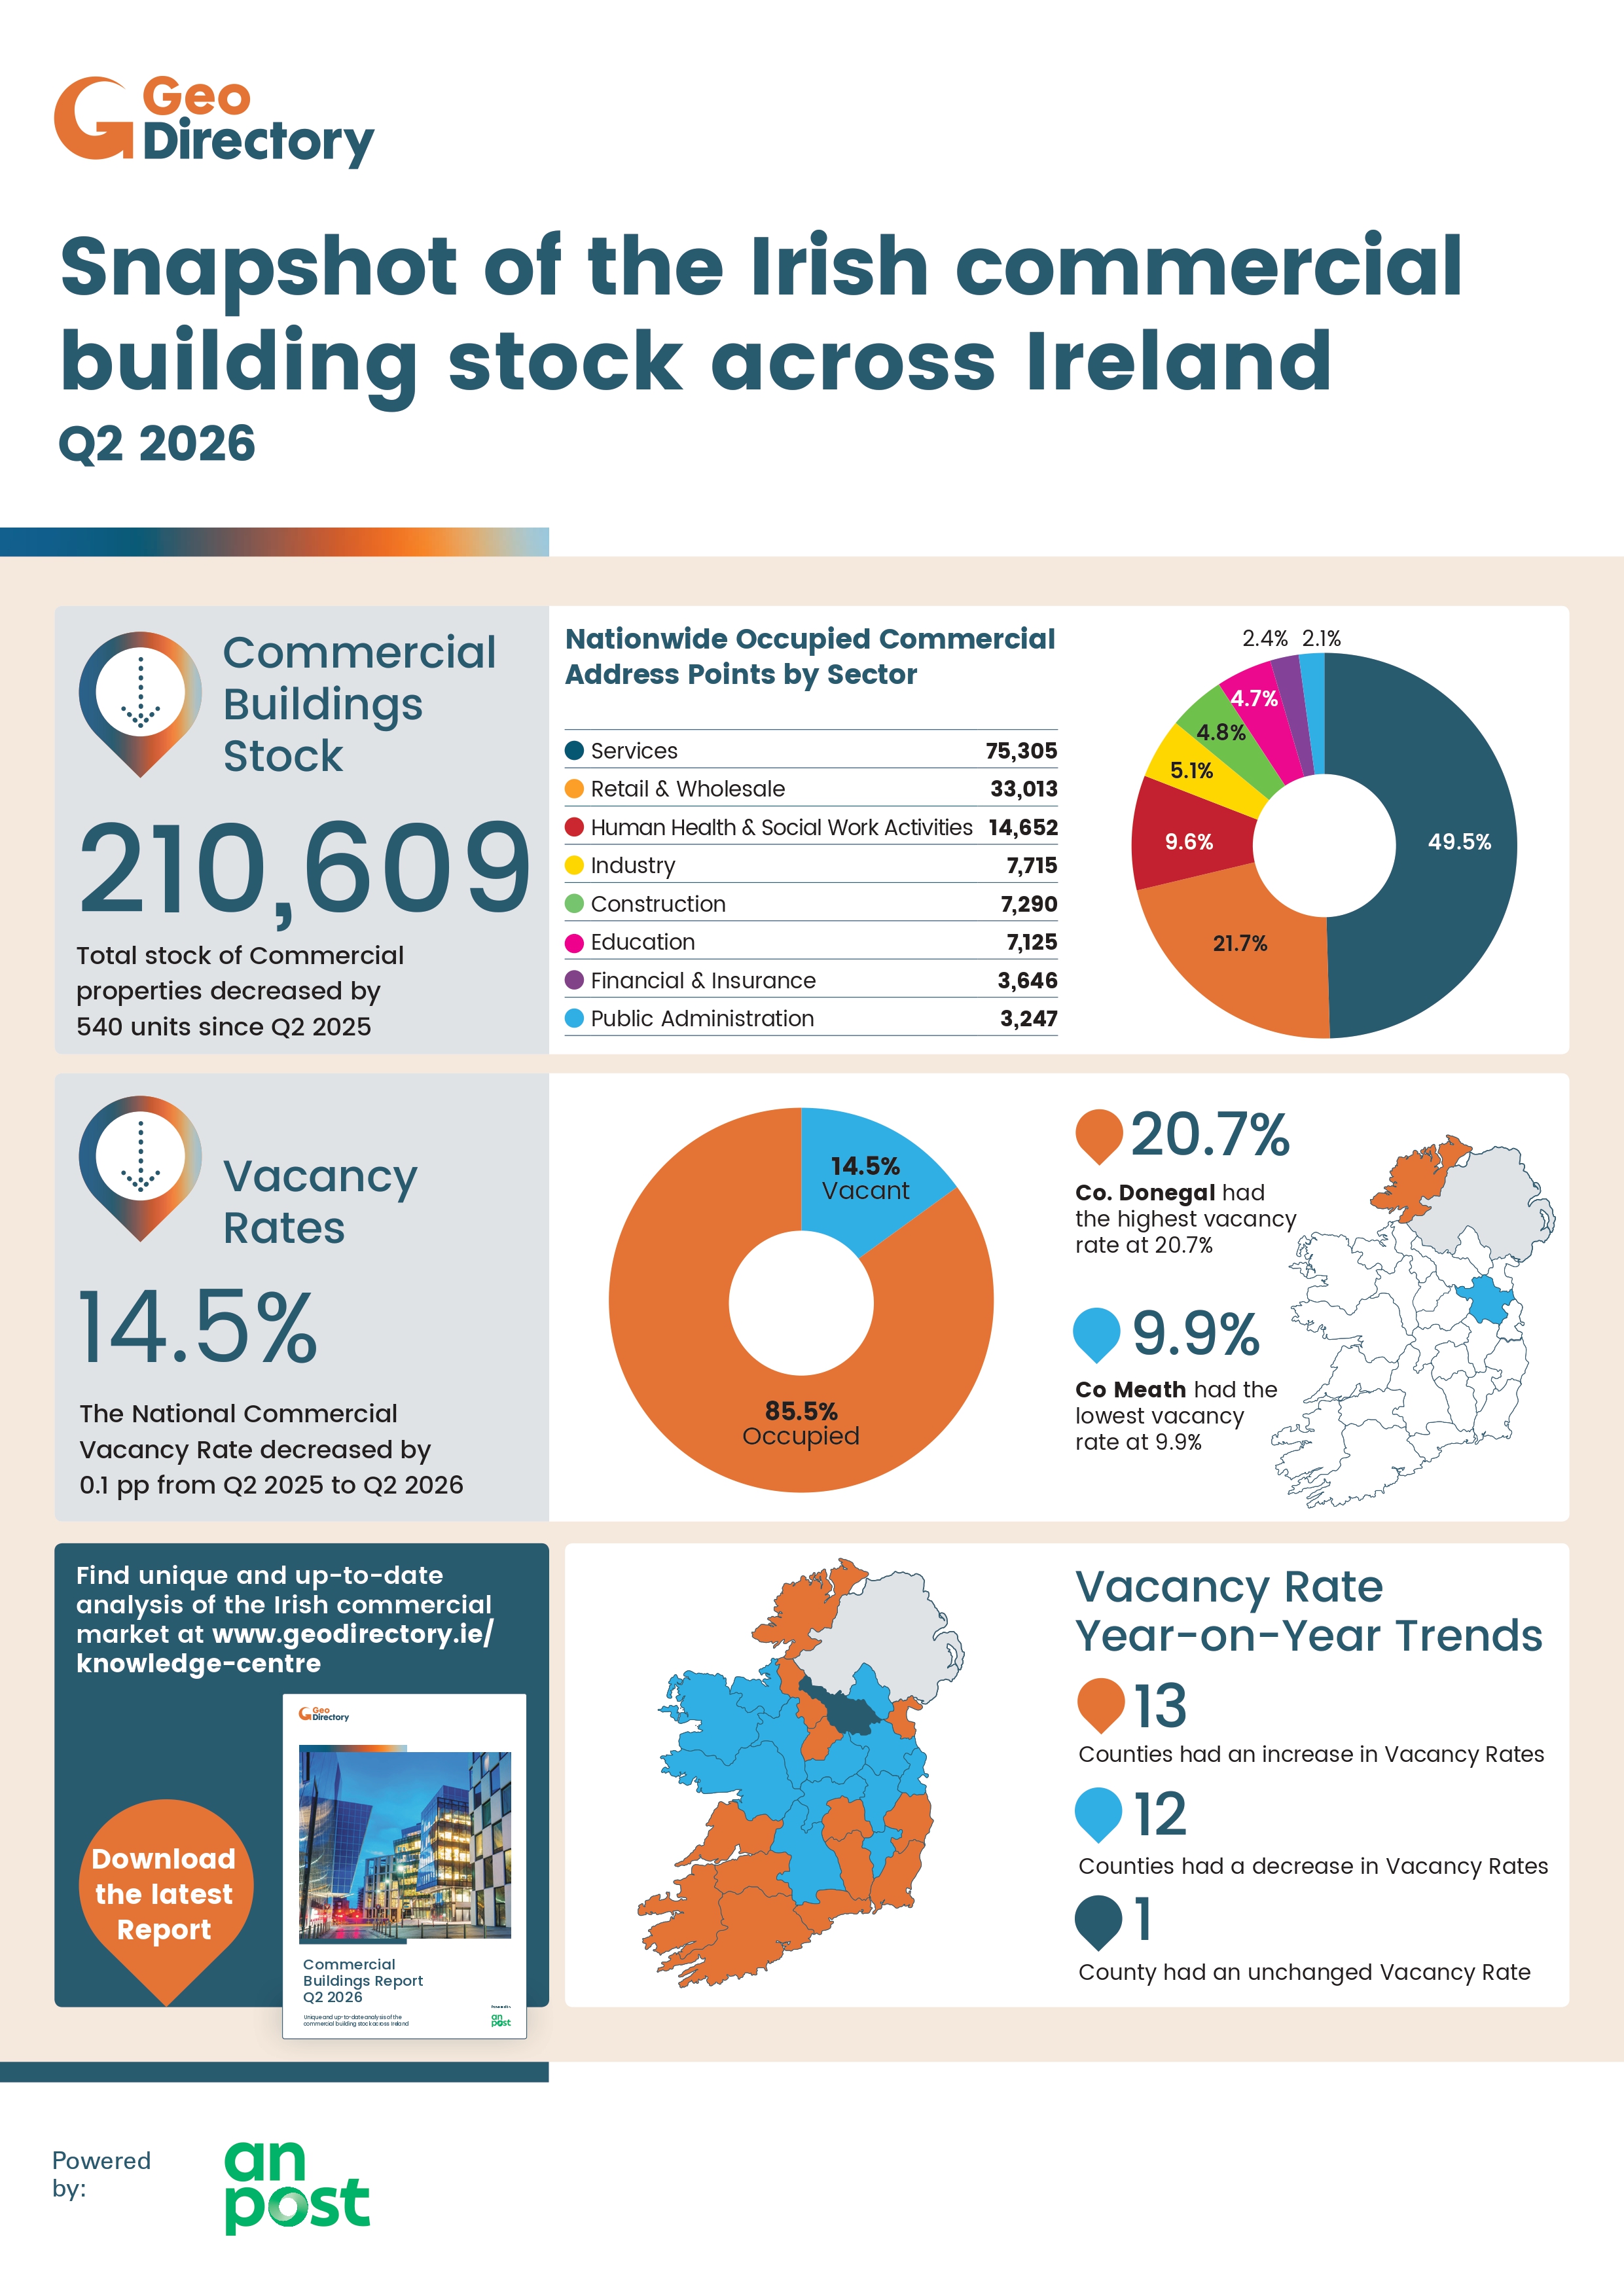
Ireland’s commercial property market continued to evolve in Q2 2026, with the national commercial vacancy rate recording its first year-on-year decline since reporting began in 2013. The infographic below highlights the key commercial property trends, including vacancy rates, regional variations and sector activity across Ireland.
_page-0001-(1).jpg "GeoDirectory_Commercial-Buildings-Report_Issue-31_infographic-(1)_page-0001-(1).jpg")
The Q2 2026 report highlights some important trends in Ireland’s commercial property market:
- 30,611 commercial units recorded as vacant nationwide.
- 14.5% national commercial vacancy rate, down 0.1 percentage points year-on-year.
- Vacancy rates increased in 13 of the 26 counties, while falling in 12 and remaining unchanged in Cavan.
- Donegal recorded the highest county vacancy rate.
- Meath recorded the lowest vacancy rate.
- Dublin’s commercial vacancy rate fell to 13.3%, down 0.6 percentage points year-on-year.
The first annual decline in the national commercial vacancy rate is a notable development for Ireland’s commercial property market. However, significant regional differences remain, with vacancy rates continuing to rise in many counties, particularly across the West and North-West.
The report also examines changes across key economic sectors. Services remains the largest category of occupied commercial units nationally, accounting for 49.5%, followed by Retail and Wholesale at 21.7% and Health at 9.6%.
Download the latest GeoDirectory Commercial Vacancy Rates Report Q2 2026 to explore the full findings, regional variations and county-level analysis of Ireland’s commercial property market.