Sharp uptake of Commercial Properties in Dublin
Recent economic reports seem to suggest increasing wealth, lower debt levels and growing consumer confidence with the cautionary note of Brexit and a potential EU/US trade war. Using the recently published GeoView Commercial Vacancy Report by GeoDirectory, we can measure Dublin’s economic performance by using commercial vacancies as a barometer of economic activity. It is based on a simple premise - The greater the level of commercial vacancy the weaker the overall economy
Encouragingly, the report shows that the national commercial vacancy rate has fallen in the twelve months to June 2018. It also shows that the economic recovery is beginning to take hold outside of Dublin, albeit at a much slower rate than the capital. Some key stats of the report are available below.
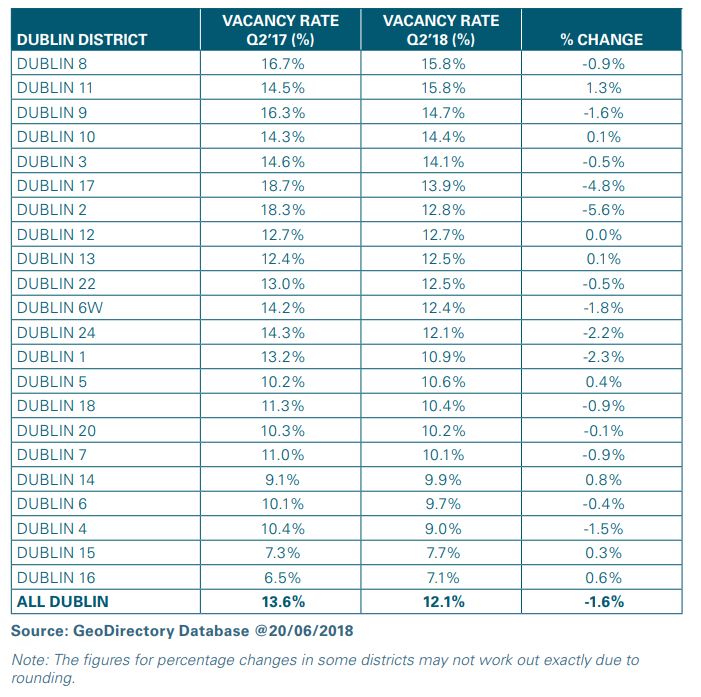
Unfortunately the area with the biggest increase in commercial vacancy was Dublin 11 with commercial vacancies up 1.3% to 15.8%. This makes Dublin 11 the joint highest area for commercial vacancies in the capital along with Dublin 8.
Dublin 16 has the lowest vacancy rate at 7.1%, but actually recorded an increase in the level of vacancies (0.6%). Interestingly Dublin 15, with the second lowest vacancy rate (7.7%), also saw an increase its commercial vacancy rate of 0.3%. This may indicate that a vacancy rate of around 7-8% may be the natural commercial market level in Dublin.
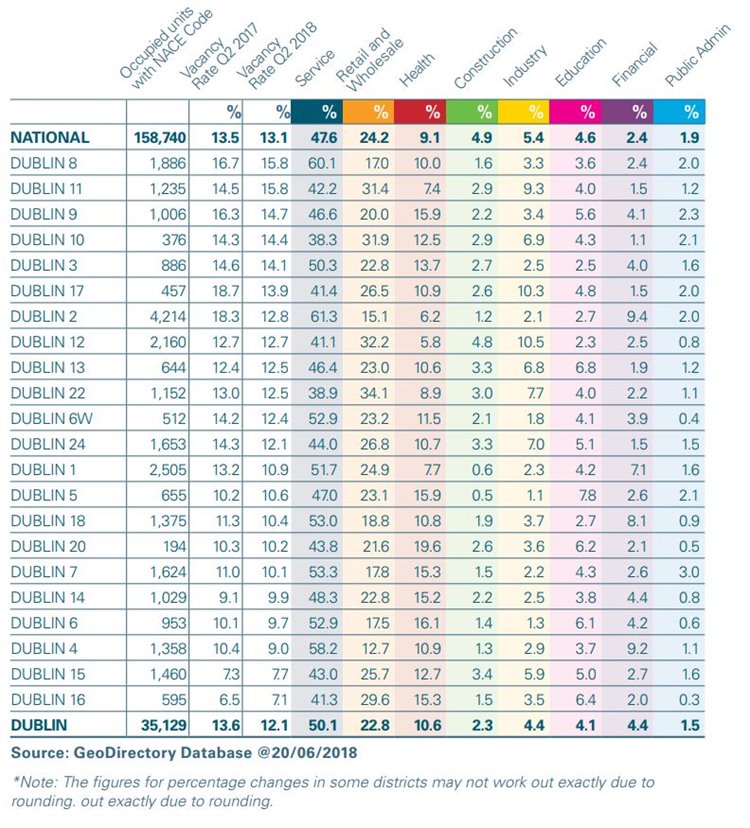
As you can see from the table below the service sector followed by retail are the biggest drivers of economic activity. Unsurprisingly the service sector is particularly strong in Dublin 2, with 61.3% of all businesses and 58.2 of all businesses in Dublin 4. The service sector is also very strong in Dublin 8 which recorded the second highest percentage, behind Dublin 2, at 60.1%
The retail sector is strongest in Dublin 22 (34.1%), Dublin 12 (32.2%) and Dublin 10 (31.9%) albeit the overall numbers in Dublin 10 are much smaller.
Retail is at its weakest in Dublin 4 (12.7%), Dublin 2 (15.1) and Dublin 8 (17%). Dublin 1 still has relatively healthy retail sector at 24.9% but overall the figures would show that retail has moved away from city and out to the suburbs.
Dublin 1 and Dublin 2 continue to have the highest concentrations of businesses. Dublin 1, Dublin 2 and Dublin 4 also have noticeably higher proportions of commercial units involved in the financial and insurance sector, with 7.1%, 9.4% and 9.2% respectively.
Based on the findings of the latest GeoView Commerical Vacancy Report, Dublin is performing well with an increase in uptake of commercial units in 16 postal districts. The past twelve months has seen a significant uptake in commercial properties in Dublin 2 and there remains plenty scope for development across the city. See the full Commercial Vacancy Property Report here.
See the GeoView Residential Property Report visit here
For GeoDirectory's Products & Services see visit here
For blog on Big Data visit here
Encouragingly, the report shows that the national commercial vacancy rate has fallen in the twelve months to June 2018. It also shows that the economic recovery is beginning to take hold outside of Dublin, albeit at a much slower rate than the capital. Some key stats of the report are available below.
Geoview Commercial Vacancy Report: Key Stats
- 13.1% National Commercial Vacancy Rate
- 15.8% Dublin Highest Commercial Vacancy in Dublin 8 & 11
- 7.1% Dublin Lowest Commercial Vacancy Rate Dublin 16
- 10.4% Lowest County Commercial Rate – Kerry & Meath
- 18.9% Highest County Commercial Rate – Sligo
- 28.9% Town with highest Commercial Rate – Ballybofey, Co. Donegal
As you can see from the table below the biggest decline in commercial vacancy rates was in Dublin 2, with a steep decline of 5.6% resulting in the vacancy rates dropping from 18.3% in 2017 to 12.8% in 2018. This increasing level of uptake on commercial premises in Dublin will clearly put a push on higher rents, although with 12.1% vacancy there is still scope for finding the right premises at the right price. Perhaps surprisingly, Dublin 17 recorded the second biggest decline (4.8%) with a current vacancy rate of 13.9%.
Vacancy Rates by Dublin District, Q2 2018
Unfortunately the area with the biggest increase in commercial vacancy was Dublin 11 with commercial vacancies up 1.3% to 15.8%. This makes Dublin 11 the joint highest area for commercial vacancies in the capital along with Dublin 8.Dublin 16 has the lowest vacancy rate at 7.1%, but actually recorded an increase in the level of vacancies (0.6%). Interestingly Dublin 15, with the second lowest vacancy rate (7.7%), also saw an increase its commercial vacancy rate of 0.3%. This may indicate that a vacancy rate of around 7-8% may be the natural commercial market level in Dublin.
Biggest Areas of Economic Activity
In addition to looking at the level of vacancies we also looked at the key types of economic activity that was taking place in Dublin. We have used NACE* codes to segment the business into eight broad commercial types. We have been able to assign NACE to circa 75% of the business so the analysis can provide some key insights in the core economic activity of the capital.As you can see from the table below the service sector followed by retail are the biggest drivers of economic activity. Unsurprisingly the service sector is particularly strong in Dublin 2, with 61.3% of all businesses and 58.2 of all businesses in Dublin 4. The service sector is also very strong in Dublin 8 which recorded the second highest percentage, behind Dublin 2, at 60.1%
The retail sector is strongest in Dublin 22 (34.1%), Dublin 12 (32.2%) and Dublin 10 (31.9%) albeit the overall numbers in Dublin 10 are much smaller.
Retail is at its weakest in Dublin 4 (12.7%), Dublin 2 (15.1) and Dublin 8 (17%). Dublin 1 still has relatively healthy retail sector at 24.9% but overall the figures would show that retail has moved away from city and out to the suburbs.
NACE - Percentage Breakdown by Dublin district, Q2 2018
Dublin 1 and Dublin 2 continue to have the highest concentrations of businesses. Dublin 1, Dublin 2 and Dublin 4 also have noticeably higher proportions of commercial units involved in the financial and insurance sector, with 7.1%, 9.4% and 9.2% respectively.
Summary
Based on the findings of the latest GeoView Commerical Vacancy Report, Dublin is performing well with an increase in uptake of commercial units in 16 postal districts. The past twelve months has seen a significant uptake in commercial properties in Dublin 2 and there remains plenty scope for development across the city. See the full Commercial Vacancy Property Report here.
Useful Links
See the GeoView Residential Property Report visit here For GeoDirectory's Products & Services see visit here
For blog on Big Data visit here
Posted: 17/08/2018 15:59:04
Discover more insights
Get the latest news, insights and trends from the GeoDirectory blog